(back
to list)

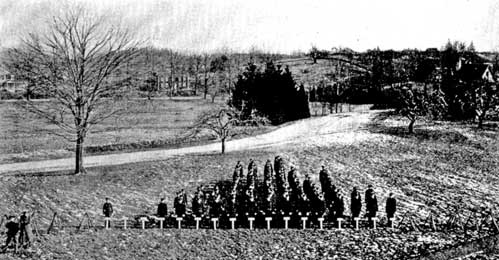
CADETS ARRANGED TO SHOW NORMAL CURVE OF VARIABILITY
Fig. 14.—The above company of students at Connecticut Agricultural College
was grouped according to height and photographed by A. F. Blakeslee. The height
of each rank, and the number of men of that height, is shown by the figures
underneath the photograph. The company constitutes what is technically known
as a "population" grouped
in "arrays of variates"; the middle rank gives the median height of
the population; the tallest array (5 ft., 8 in.) is the mode. If a line be drawn
connecting the upper ends of the rows, the resulting geometric figure will be
a "scheme of distribution of variates" or more briefly a "variability
curve," such as was shown in several preceding figures. The arrangement
of homogeneous objects of any kind in such form as this is the first step in
the study of variation by modern statistical methods, and on such study much
of the progress of genetics depends.
PREVIOUS NEXT


